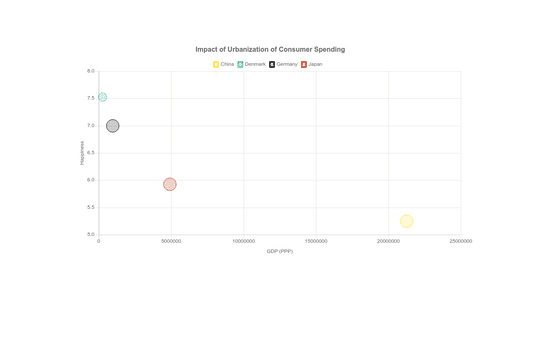
Charts.js Bubble Chart


Cloneable tags
Description
The Charts.js Bubble Chart technique demonstrates how to add a Chart.js bubble chart to Webflow. This technique uses an HTML embed to work properly, so you'll need to add the HTML embed to your Webflow site in order to use it. This method could potentially be tied into Webflow's native CMS system, allowing the chart to be updated and populated using the CMS. This Webflow cloneable has been categorized under the Charts.js and Charts categories and was created by Joe Wolf. Whether you're looking to add a charting element to your Webflow site or simply want to enhance the data visualization capabilities of your site, the Charts.js Bubble Chart technique is a valuable tool to have at your disposal. By using this technique, you can easily add a Chart.js bubble chart to your Webflow site and potentially tie it into your CMS system to allow for dynamic updates.